

Most Read Tech & Science News — Q2 2026
This is the Tech & Science instalment of the Q2 2026 quarterly series. Every ranking here derives from one signal: real readers clicking real articles, as reflected in each outlet's own Most Read list. How the recording works is documented in full on the methodology page.
The vertical's defining story of the quarter was an ironic one — Microsoft pulling a developer-favourite AI coding tool from its own engineers in the middle of the AI boom, which went on to hold The Verge's #1 spot for 79 hours, more time at the top than any other story I tracked this quarter.
I track four Tech & Science sources. TechCrunch and New Scientist only came online mid-quarter, so this report draws on the two with complete Q2 data: Ars Technica and The Verge. The other two debut in the Q3 report.
How the two compare
Tech stories stay on Most Read lists far longer than general news does. Across the nine sources tracked for the full quarter, the median article holds a slot for 6 hours. Both tech sources sit far above that baseline:
| Organization | Median Duration (Hours) | Median, +reconstructed | 90th Percentile Duration (Hours) | Turn Rate (Per 24h) |
|---|---|---|---|---|
| The Verge | 22.0 | 22.0 | 45.0 | 1.09 |
| Ars Technica | 16.0 | 23.0 | 38.0 | 1.50 |
| All 9 sources, pooled | 6.0 | 7.0 | 24.0 | 4.00 |
The first median counts only readings my scraper actually took; the second also counts short gaps filled by interpolation. The 90th Percentile and Turn Rate columns are on the direct count. Ars Technica is the one source in this vertical where the choice matters — and it matters enough to reverse the two rows.
Definitions for these metrics, and the two mechanisms that plausibly explain why tech lists move so slowly, are covered in the quarterly overview and the methodology page.
A note on Ars Technica's data. Ars Technica has the second-lowest directly-recorded share in the dataset (only AP News is lower) — 71.0% of its Q2 readings were recorded directly, the rest reconstructed from surrounding readings (The Verge is 99.6% direct). Its coverage, though, is a healthy 92.9%: it was tracked steadily all quarter, so this uncertainty comes from interpolation across short gaps, not from missing stretches of record. Counting reconstructed readings as well, its median rises to 23.0 hours and its 90th percentile to 54.0 — fractionally ahead of The Verge's 22.0, so which of these two lists is the slowest-moving in the whole dataset genuinely depends on which count you accept. I don't think the evidence picks a winner. The per-article figures in the Top 10s below — Total Index Footprint, Peak Residency and Position Path — include reconstructed readings for both sources, so they are on a like-for-like basis with each other, but Ars's carry wider uncertainty than The Verge's. Full detail on the methodology page.
Most Read Articles at a glance
Entries are ranked by the Popularity Score, which weights both how long an article stayed on a list and how high it climbed. Position weighs heavily — an hour at #1 is worth many times an hour at the foot of the list — so an entry can rank above one showing a longer footprint and more time at #1. The exact formula is not published.
Top 10 — Ars Technica, Q2 2026
- Sony erases digital content from libraries; we're reminded we don't own what we buy
- A satellite company supporting Ukraine appears to be in Russia's crosshairs
- Here's why the failure of Blue Origin's New Glenn rocket is so catastrophic
- Amazon stuck with months of repairs after drone strikes on data centers
- "S&P 500 blocks fast SpaceX entry, won't waive rule for unprofitable AI firms"
- "Verizon sent man a refurbished phone with MDM, then deleted his data remotely"
- Engineers at NASA's Jet Propulsion Lab make a breakthrough in rotor technology
- "Cognitive surrender" leads AI users to abandon logical thinking, research finds
- Twin brothers wipe 96 gov't databases minutes after being fired
- Ridley Scott's post-apocalyptic The Dog Stars drops first trailer
Top 10 — The Verge, Q2 2026
- Microsoft starts canceling Claude Code licenses
- Apple's weird anti-nausea dots cured my car sickness
- Meta launches cheaper smart glasses without Ray-Ban
- Google's new anything-to-anything AI model is wild
- The world's first trillionaire is a killer
- Is the Slate Truck too minimal for its own good?
- Apple raises the Mac Mini's starting price
- Trump fires the entire National Science Board
- Our long national sunscreen nightmare is almost over
- "If I could only have one laptop for work and gaming, I'd get this one"
Archetype taxonomy
Each deep-dive below is tagged with a shape — how the article moved through the list over its lifetime — wherever one of these shapes applies. A reign is a real stint at #1 (at least 15% of the article's Total Index Footprint); a dominant reign is one of at least 30%; a graze is a passing touch at #1 below the reign threshold. The seven shapes are defined by fixed quantitative rules:
| Archetype | Quantitative definitional rules |
|---|---|
| Multi-Strike Apex | Two or more separate #1 blocks, each lasting at least 15% of the article's Total Index Footprint, combined with a total footprint of 70 hours or more — two genuine commanding stints at the top, not incidental touches. |
| Monolithic Overlord | A single continuous block at #1 accounting for 80% or more of the article's Total Index Footprint. |
| Perennial Contender | Never reaches #1, yet sustains a Total Index Footprint of 70 hours or more while making three or more distinct upward moves among the lower slots — a long-lived runner-up that stayed in contention without ever topping the list. |
| Sub-Peak Oscillator | Reaches #1 but never holds it for a single continuous stint of 30% or more of its Total Index Footprint — no dominant reign — then makes three or more distinct upward moves among the below-#1 slots after leaving the top. |
| Abrupt Cliff | Held a dominant reign at #1 — a single continuous block of 30% or more of the Total Index Footprint — then falls from the top by two or more slots, to #3 or worse, on its final departure from a genuine stint (not a lone passing touch), with no subsequent return to #1. |
| Soft-Landing Decline | Reaches #1 exactly once, after which every recorded move is non-improving — each reading at the same slot or lower. |
| Fading Dominant | Held a dominant reign at #1 — a single continuous block of 30% or more of the Total Index Footprint — then fades: after it last leaves #1 the trajectory trends downward, with no single recovery of more than two slots. The noisy-tailed counterpart to the Soft-Landing Decline. |
Where an article satisfies more than one rule, the shape is assigned by precedence — Multi-Strike Apex, then Monolithic Overlord, Perennial Contender, Sub-Peak Oscillator, Abrupt Cliff, Soft-Landing Decline, Fading Dominant — so the rarest qualifying pattern wins. A few articles match no shape and are left untagged rather than forced into one.
A closer look: Ars Technica
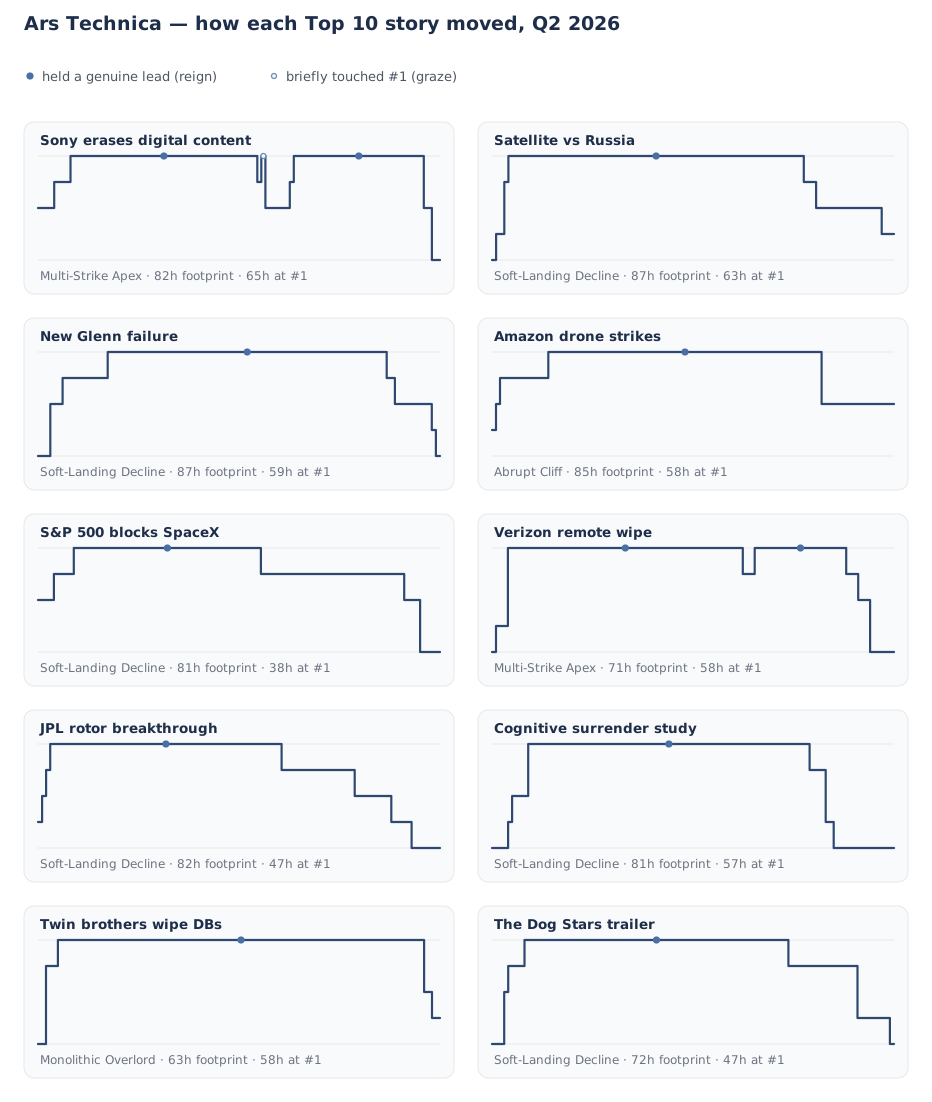
1. Sony erases digital content from libraries
- Peak Residency:
65 hours at #1 - Total Index Footprint:
82 hours - Position Path:
3 (4%) → 2 (4%) → 1 (46%) → 2 (1%) → 1 (1%) → 3 (6%) → 2 (1%) → 1 (32%) → 3 (2%) → 5 (2%) - Shape:
Multi-Strike Apex
Sony told UK PlayStation owners that 551 titles they'd already paid for would be permanently deleted as licensing agreements lapsed — the kind of ownership dispute that reliably provokes anger. That attention came in two waves: an initial run to #1, a brief dip, then a second climb back to the top before the story finally faded. Across its 82-hour life — more than five times Ars Technica's 16-hour median — it barely left the top three.
2. A satellite company supporting Ukraine appears to be in Russia's crosshairs
- Peak Residency:
63 hours at #1 - Total Index Footprint:
87 hours - Position Path:
5 (1%) → 4 (2%) → 2 (1%) → 1 (72%) → 2 (3%) → 3 (16%) → 4 (3%) - Shape:
Soft-Landing Decline
Military tracking data showed four Russian satellites shifting orbital planes to shadow a radar-imaging platform used by Ukraine's military — a quiet, unsettling story about surveillance in orbit rather than a loud one. It commanded #1 for just over two and a half days, more than triple the median time an Ars story spends anywhere on the list, before stepping down in a single orderly slide and dropping off the list.
3. Here's why the failure of Blue Origin's New Glenn rocket is so catastrophic
- Peak Residency:
59 hours at #1 - Total Index Footprint:
87 hours - Position Path:
5 (3%) → 3 (3%) → 2 (11%) → 1 (68%) → 2 (2%) → 3 (9%) → 4 (1%) → 5 (1%) - Shape:
Soft-Landing Decline
A static-fire test explosion took out a Florida launch pad and left NASA's lunar programme single-sourced to competitors — real stakes for Artemis, not just for Blue Origin. Space and aerospace stories were a strong thread on Ars this quarter (three of its top ten, this one included), and this one held a dominant 68% reign at #1 before an orderly, one-slot-at-a-time decline, sustaining a top-tier presence for over two full days.
4. Amazon stuck with months of repairs after drone strikes on data centers
- Peak Residency:
58 hours at #1 - Total Index Footprint:
85 hours - Position Path:
4 (1%) → 3 (1%) → 2 (12%) → 1 (68%) → 3 (18%) - Shape:
Abrupt Cliff
Drone strikes physically destroyed three AWS server nodes in the Middle East, knocking out core racks and triggering months of repair work — the kind of infrastructure story that doesn't normally reach #1, since Ars's hardware coverage rarely runs this long. This one did, holding the top spot for 68% of its 85-hour life, before a sharp two-slot fall to #3 ended its run at the top for good.
5. "S&P 500 blocks fast SpaceX entry, won't waive rule for unprofitable AI firms"
- Peak Residency:
38 hours at #1 - Total Index Footprint:
81 hours - Position Path:
3 (4%) → 2 (5%) → 1 (47%) → 2 (36%) → 3 (4%) → 5 (5%) - Shape:
Soft-Landing Decline
The S&P 500 committee declined to fast-track SpaceX into the index or waive its profitability rule for money-losing AI companies — a governance story about strict index rules holding firm against Silicon Valley pressure. It's also the only one of Ars's top five to spend under half its life at #1: after a single run at the top it settled into #2 for nearly as long as it held the lead, an unusually heavy second-place dwell.
6. "Verizon sent man a refurbished phone with MDM, then deleted his data remotely"
- Peak Residency:
58 hours at #1 - Total Index Footprint:
71 hours - Position Path:
5 (1%) → 4 (3%) → 1 (59%) → 2 (3%) → 1 (23%) → 2 (3%) → 3 (3%) → 5 (6%) - Shape:
Multi-Strike Apex
A Verizon customer's replacement phone arrived still locked to a corporate device-management profile — and when that profile triggered a remote wipe, it erased years of the customer's own files that had never been backed up. Losing irreplaceable personal data to someone else's oversight reliably provokes anger, and the attention came in two separate waves at the top: an initial 59% run, a brief drop to #2, then a second stint worth 23% of its life before the story finally faded.
7. Engineers at NASA's Jet Propulsion Lab make a breakthrough in rotor technology
- Peak Residency:
47 hours at #1 - Total Index Footprint:
82 hours - Position Path:
4 (1%) → 3 (1%) → 2 (1%) → 1 (57%) → 2 (18%) → 3 (9%) → 4 (5%) → 5 (7%) - Shape:
Soft-Landing Decline
JPL engineers pushed next-generation rotor blades to Mach 1.08 in low-density vacuum-chamber tests — a genuine engineering milestone for Mars-flight rotorcraft, and another of the quarter's space entries on Ars, free of any policy or business controversy. It held #1 for 57% of its 82-hour life, then eased down the list one slot at a time until it dropped off entirely: about as textbook a Soft-Landing Decline as the quarter produced.
8. "Cognitive surrender" leads AI users to abandon logical thinking, research finds
- Peak Residency:
57 hours at #1 - Total Index Footprint:
81 hours - Position Path:
5 (4%) → 4 (1%) → 3 (4%) → 1 (70%) → 2 (4%) → 4 (2%) → 5 (15%) - Shape:
Soft-Landing Decline
A University of Pennsylvania study found that people readily hand off their own critical thinking to large language models, accepting flawed AI reasoning without double-checking it — an uncomfortable finding for anyone who leans on these tools daily. It locked in a dominant 70% run at #1 across an 81-hour life, then stepped cleanly down without recovering.
9. Twin brothers wipe 96 gov't databases minutes after being fired
- Peak Residency:
58 hours at #1 - Total Index Footprint:
63 hours - Position Path:
5 (2%) → 2 (3%) → 1 (92%) → 3 (2%) → 4 (2%) - Shape:
Monolithic Overlord
Two twin IT contractors used administrative credentials to wipe 96 federal databases within minutes of being fired — and left a video call running that recorded the entire plan. It's the quarter's clearest Monolithic Overlord: 92% of its 63-hour life spent locked at #1, before dropping off the list entirely.
10. Ridley Scott's post-apocalyptic The Dog Stars drops first trailer
- Peak Residency:
47 hours at #1 - Total Index Footprint:
72 hours - Position Path:
5 (3%) → 3 (1%) → 2 (4%) → 1 (65%) → 2 (17%) → 4 (8%) → 5 (1%) - Shape:
Soft-Landing Decline
Entertainment coverage doesn't usually outlast Ars's core technical reporting, but the first trailer for Ridley Scott's adaptation of Peter Heller's post-pandemic novel The Dog Stars proved an exception. It held #1 for 65% of its life, and its 72-hour total footprint nearly doubled the publication's 38-hour 90th-percentile threshold — before easing back down without climbing again: a rare Soft-Landing Decline for a culture piece.
A closer look: The Verge
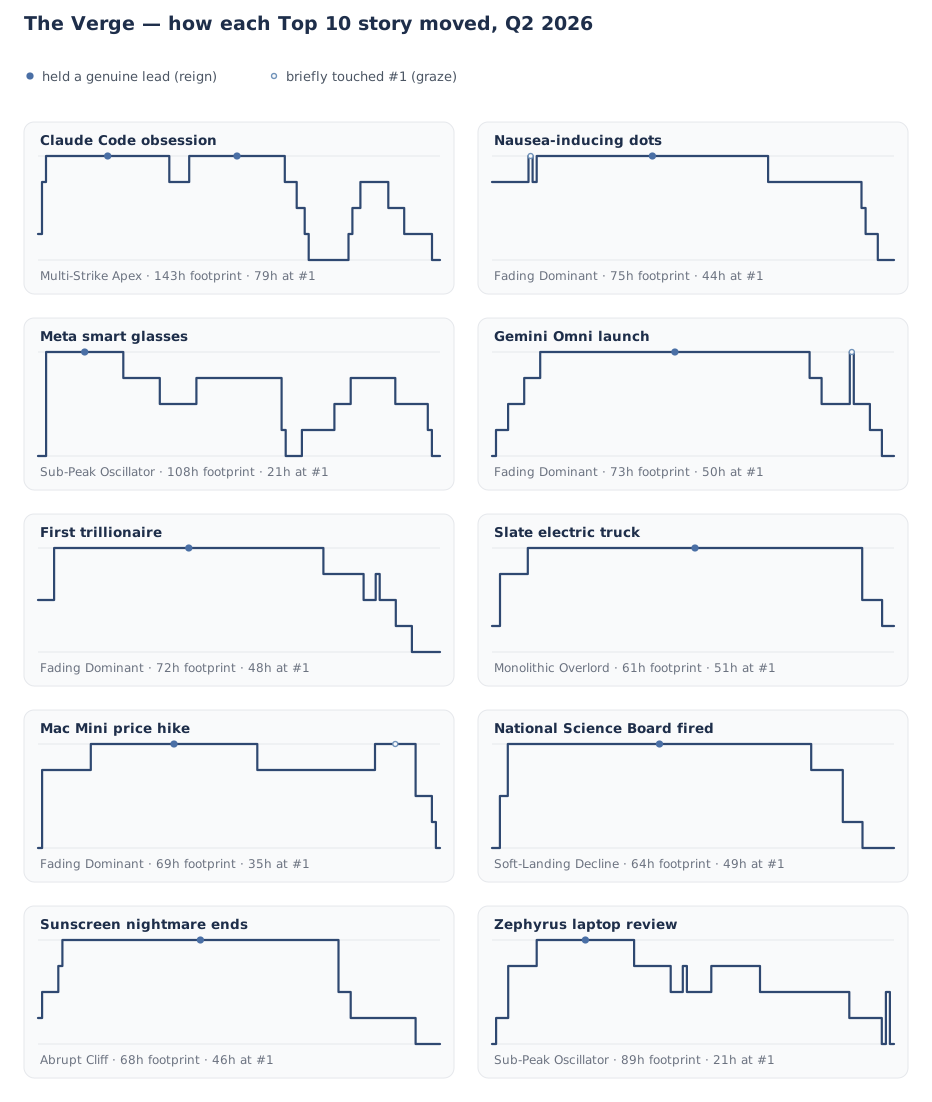
1. Microsoft starts canceling Claude Code licenses
- Peak Residency:
79 hours at #1 - Total Index Footprint:
143 hours - Position Path:
4 (1%) → 2 (1%) → 1 (31%) → 2 (5%) → 1 (24%) → 2 (3%) → 3 (2%) → 4 (1%) → 5 (10%) → 4 (1%) → 3 (2%) → 2 (7%) → 3 (4%) → 4 (7%) → 5 (2%) - Shape:
Multi-Strike Apex
Microsoft telling its own engineers it was pulling their premium Claude Code licences to cut costs before a fiscal year-end deadline is the kind of self-inflicted irony that keeps a story alive — and this one stayed alive longer than anything else I tracked all quarter. It held #1 for 79 hours, more than three days at the top, across two separate stints without ever falling off the list. Its 143-hour total footprint is the longest of any tech story this quarter, though not of the whole dataset: a Business Insider human-interest evergreen lingered longer overall, mostly in the lower slots, without ever commanding #1 the way this one did.
2. Apple's weird anti-nausea dots cured my car sickness
- Peak Residency:
44 hours at #1 - Total Index Footprint:
75 hours - Position Path:
2 (9%) → 1 (1%) → 2 (1%) → 1 (57%) → 2 (23%) → 3 (1%) → 4 (3%) → 5 (4%) - Shape:
Fading Dominant
A first-person review of Apple's new motion-cue feature — moving peripheral dots that visually counter travel sickness — turned into one of the steadiest performers on the list: 91% of its 75-hour life spent in the top two slots. Its two touches of #1 are too lopsided to count as a Multi-Strike Apex — a brief 1% graze, then a commanding 57% reign — so it lands instead as a Fading Dominant.
3. Meta launches cheaper smart glasses without Ray-Ban
- Peak Residency:
21 hours at #1 - Total Index Footprint:
108 hours - Position Path:
5 (2%) → 1 (19%) → 2 (9%) → 3 (9%) → 2 (21%) → 4 (1%) → 5 (4%) → 4 (8%) → 3 (4%) → 2 (11%) → 3 (8%) → 4 (1%) → 5 (2%) - Shape:
Sub-Peak Oscillator
Meta's cheaper smart-glasses line dropped the Ray-Ban branding but added facial-recognition testing — a genuine privacy question sitting inside a hands-on review. It held #1 only briefly (19% of its life) before settling into a long middle-of-the-list run: 108 hours total, more time below #1 than any other Verge entry here, with attention likely sustained by the facial-recognition question the piece raises.
4. Google's new anything-to-anything AI model is wild
- Peak Residency:
50 hours at #1 - Total Index Footprint:
73 hours - Position Path:
5 (1%) → 4 (3%) → 3 (4%) → 2 (4%) → 1 (67%) → 2 (3%) → 3 (7%) → 1 (1%) → 3 (4%) → 4 (3%) → 5 (3%) - Shape:
Fading Dominant
Google's hands-on with the Gemini Omni model showed off photorealistic deepfake video rendering — genuinely impressive, and exactly the capability that makes deepfakes harder to catch — set against steep plan-credit costs for actually using it. A commanding 67% reign at #1 gave way to a fade, with one late graze back to the top too brief to count as a second strike.
5. The world's first trillionaire is a killer
- Peak Residency:
48 hours at #1 - Total Index Footprint:
72 hours - Position Path:
3 (4%) → 1 (67%) → 2 (10%) → 3 (3%) → 2 (1%) → 3 (4%) → 4 (4%) → 5 (7%) - Shape:
Fading Dominant
A Verge opinion column argued that Elon Musk's path to becoming the world's first trillionaire runs directly through cuts to foreign aid and public-health budgets under a federal efficiency drive — a pointed, deliberately provocative thesis. It held #1 for 67% of its 72-hour life, then declined through the lower slots; a brief climb back from #3 to #2 partway down keeps it off the strictly monotonic Soft-Landing Decline, but with no recovery larger than a single slot, it reads as a noisy fade rather than a clean landing.
6. Is the Slate Truck too minimal for its own good?
- Peak Residency:
51 hours at #1 - Total Index Footprint:
61 hours - Position Path:
4 (2%) → 2 (7%) → 1 (84%) → 3 (5%) → 4 (3%) - Shape:
Monolithic Overlord
Slate's compact, ultra-minimalist electric truck trades serious range for a genuinely low price — the real question the review poses is whether that trade-off is worth it. The story shot straight to #1 and stayed there for 84% of its 61-hour run before dropping away entirely.
7. Apple raises the Mac Mini's starting price
- Peak Residency:
35 hours at #1 - Total Index Footprint:
69 hours - Position Path:
5 (1%) → 2 (12%) → 1 (41%) → 2 (29%) → 1 (10%) → 3 (4%) → 4 (1%) → 5 (1%) - Shape:
Fading Dominant
Apple quietly discontinued the Mac Mini's entry-level configuration, pushing the effective starting price to $799 amid AI-driven memory shortages squeezing margins across the industry — a price increase, whatever the official framing. It built a dominant 41% reign at #1, dropped back to #2, then returned to the top for a brief 10% graze — too short to count as a genuine second stint toward a Multi-Strike Apex, and also a return that rules out an Abrupt Cliff. From there it eased away through the lower slots with no further recovery, landing as a Fading Dominant.
8. Trump fires the entire National Science Board
- Peak Residency:
49 hours at #1 - Total Index Footprint:
64 hours - Position Path:
5 (2%) → 3 (2%) → 1 (77%) → 2 (8%) → 4 (5%) → 5 (8%) - Shape:
Soft-Landing Decline
The administration fired the entire National Science Board — the independent body Congress created to give the National Science Foundation its scientific guidance — a stark move against the institution built to keep federal science policy insulated from politics. It shot straight to #1 and held a dominant 77% reign, then eased off the top one slot at a time and never climbed back; a brisker 2→4 slide comes later in the tail, not off the peak itself, so the descent stays strictly downward throughout. It captured an immediate 49-hour hold at #1 before easing out of the visible slots.
9. Our long national sunscreen nightmare is almost over
- Peak Residency:
46 hours at #1 - Total Index Footprint:
68 hours - Position Path:
4 (1%) → 3 (4%) → 2 (1%) → 1 (68%) → 3 (3%) → 4 (16%) → 5 (6%) - Shape:
Abrupt Cliff
The FDA finally approved modern chemical UV filters like bemotrizinol that dermatologists have pushed for years — paired with a pointed rebuttal of the anti-sunscreen misinformation spreading on social media. It built a dominant 68% run at #1, then fell straight to #3 in a single move rather than stepping down gradually, before lingering in a low-slot tail. Its 68-hour footprint tripled the Verge's 22-hour median.
10. "If I could only have one laptop for work and gaming, I'd get this one"
- Peak Residency:
21 hours at #1 - Total Index Footprint:
89 hours - Position Path:
5 (1%) → 4 (3%) → 2 (7%) → 1 (24%) → 2 (9%) → 3 (3%) → 2 (1%) → 3 (6%) → 2 (12%) → 3 (22%) → 4 (8%) → 5 (1%) → 3 (1%) → 5 (1%) - Shape:
Sub-Peak Oscillator
Asus's 2026 ROG Zephyrus G14 got benchmarked against a backdrop of inflated global component prices — a practical buying-guide story rather than a controversy. It held #1 only briefly (24% of its life) before a long middle-of-the-pack run: 89 hours total, likely as readers kept coming back to check the specs against their own budget.
Metric definitions (Peak Residency, Total Index Footprint, Shape, Position Path, Popularity Score) and the full data-collection method are on the methodology page. The ecosystem-wide comparison across all nine sources is in the Q2 2026 overview.
Corrections: errors are fixed in place with a dated note at the foot of this page. Spotted something wrong? Get in touch.
Correction, 28 September 2026. The median across all nine sources was 6 hours, not 5, and its 90th percentile 24 hours, not 23. The Guardian figures in the Q2 set mixed its World news list with its other editions' lists, which made it look like the fastest list in the dataset. On the World news list alone, its median story lasted 8 hours (11 counting reconstructed readings). Correcting it moves the nine-source baseline quoted here. The World News report carries the details.
Note, 28 September 2026. The Popularity Score's weighting was revised in September 2026 and every score recalculated. The Top 10s on this page are ranked as at publication; the site's Q2 archives follow the current weighting, so their Top 10s can differ from the ones printed here. Other figures here are also as recorded at publication, and later clean-ups of the record can move them slightly.